Confotec® MR520 – 3D scanning laser Raman microscope-spectrometer
Interdisciplinary research at the sub-micrometer range:
Graphene has a number of unique properties (hardness, significant thermal and electrical conductivity, optical transparency, chemical stability), which makes it interesting for many applications.
To optimize technology of Graphene production, the need for measurement techniques with the capability to characterize structures with the high spatial resolution. Raman spectroscopy and microscopy are good candidates to characterize Graphene. These measurement methods are realized in Confotec® MR520 (SOL instruments) confocal microscope. Raman spectroscopy and microscopy provide information about Graphene flake thickness, structural uniformity, etc.
In this document, we demonstrate the potential of Confotec® MR520 to Graphene analysis.
The Raman measurements of Graphene were carried out in the confocal backscattering geometry using a 532 nm excitation laser, 100X objective. Graphene flakes were obtained by mechanical exfoliation of graphite and transferred onto SiO2/Si substrates (the SiO2 thickness is 300 nm). Thin flakes are sufficiently transparent, and change their interference color with respect to the thickness. It it is relatively easy to find a convenient graphene flake for Raman measurements.
Raman spectra are measured on Graphene multilayers on Si/ SiO2 are shown in Fig.1,2. Two most intense features are the G-peak at 1580 cm-1 and a 2D-band at 2700 – 2745 cm-1. Raman spectra show characteristic dependence on thickness of Graphene (Fig.1,2). Relative Intensity of G-band enhances with the number of layers. 2D-peak becomes a broader a little and shifted to the higher wavenumbers with increasing the number of layers. Raman spectra of Graphene with more than 3 layers become hardly distinguishable from each other.
Summary:
Confotec® MR520 has been used for nondestructive characterization of Graphene flakes. Raman spectra evolves clearly with the number of Graphene layers.
Publication date: 11 March 2013.
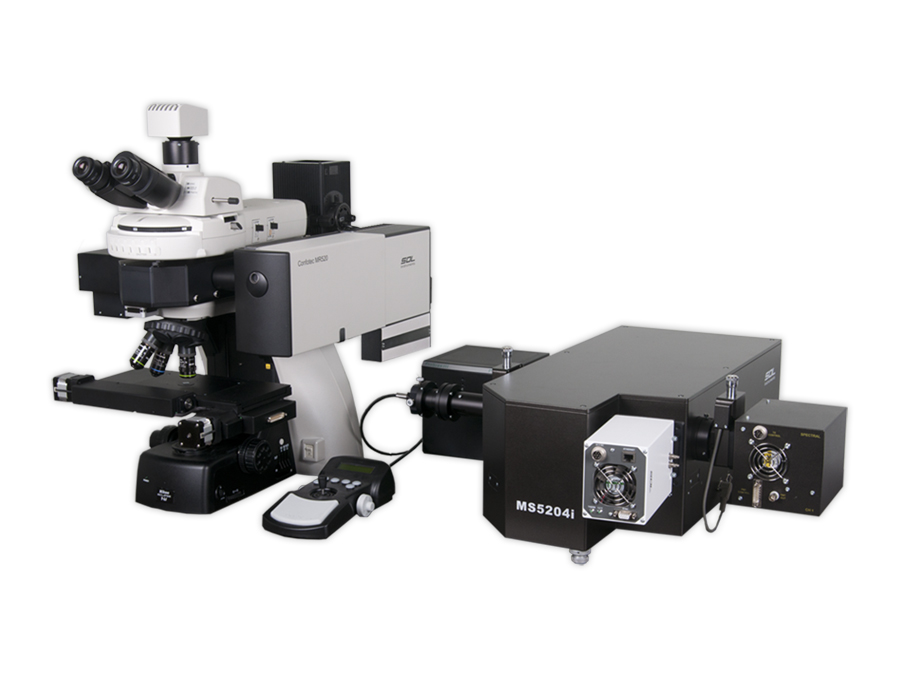
Raman 3D scanning laser confocal microscope-spectrometer Confotec® MR520 produced by SOL instruments company.

Fig.1. Evolution of the Raman spectra with the number of graphene layers: yellow color – the single layer of graphene; red color – 2 layers; blue color – 3 layers and more.
