The NanoSP program is designed for acquiring and processing spectral data when working with scanning Raman microscopes of the Confotec® series
NanoSP is a state-of-the-art software with an intuitive interface, distinguished for its ease of use, and providing the following functionality:
The NanoSP program is designed for acquiring and processing spectral data when working with scanning Raman microscopes of the Confotec® series
NanoSP is a state-of-the-art software with an intuitive interface, distinguished for its ease of use, and providing the following functionality:


Control of all automated units and modules
Performing spectral measurements at a point on the sample
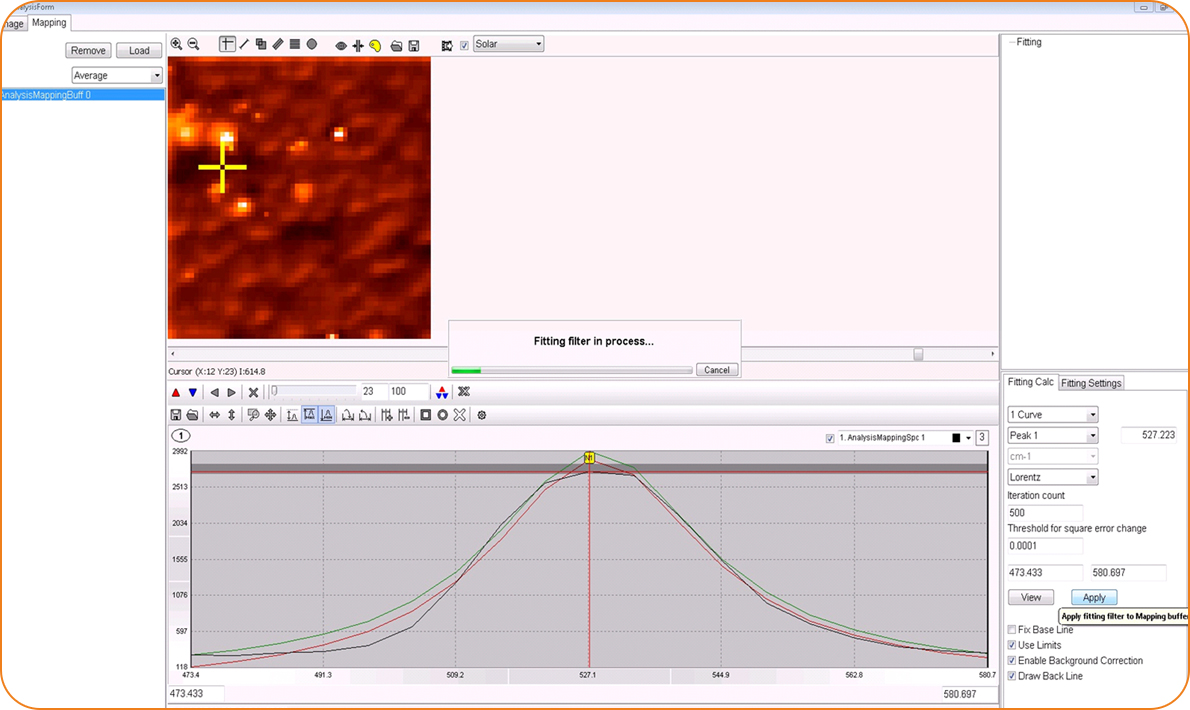
Automated fluorescence background correction
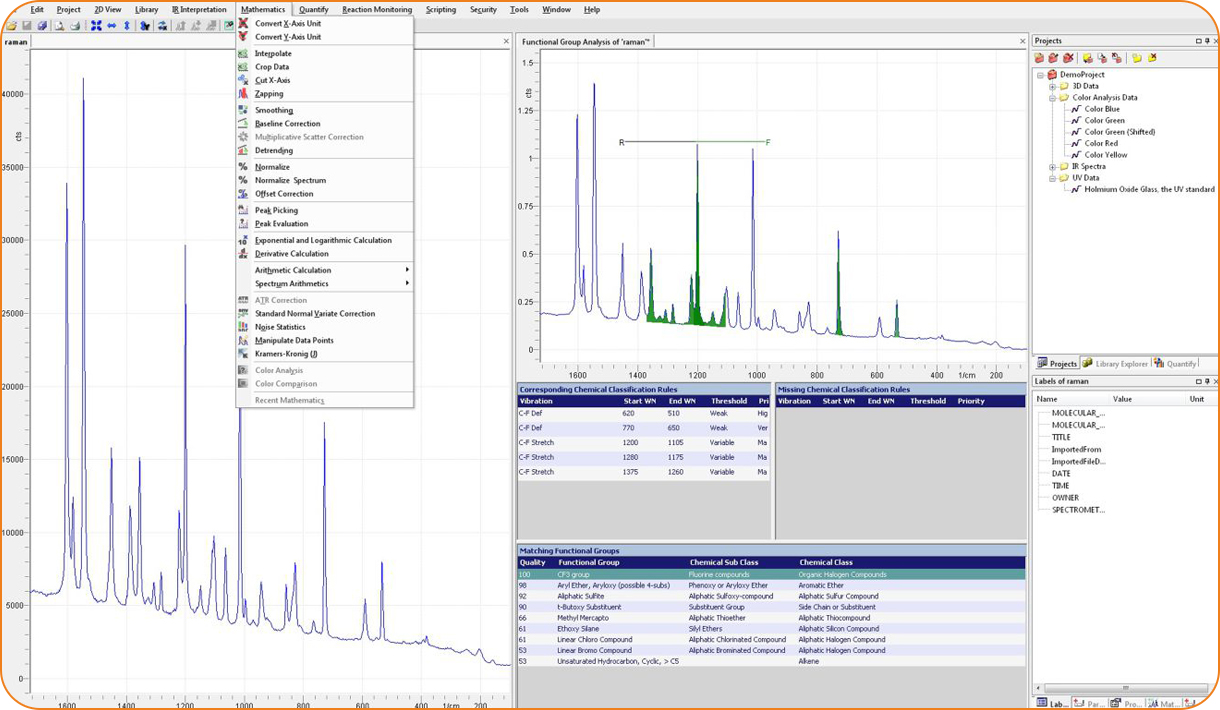
Peak fitting and Raman bands fitting

Control of all automated units and modules

Performing spectral measurements at a selected point on the sample

Automated fluorescence background correction
Peak fitting

Automated spectral calibration
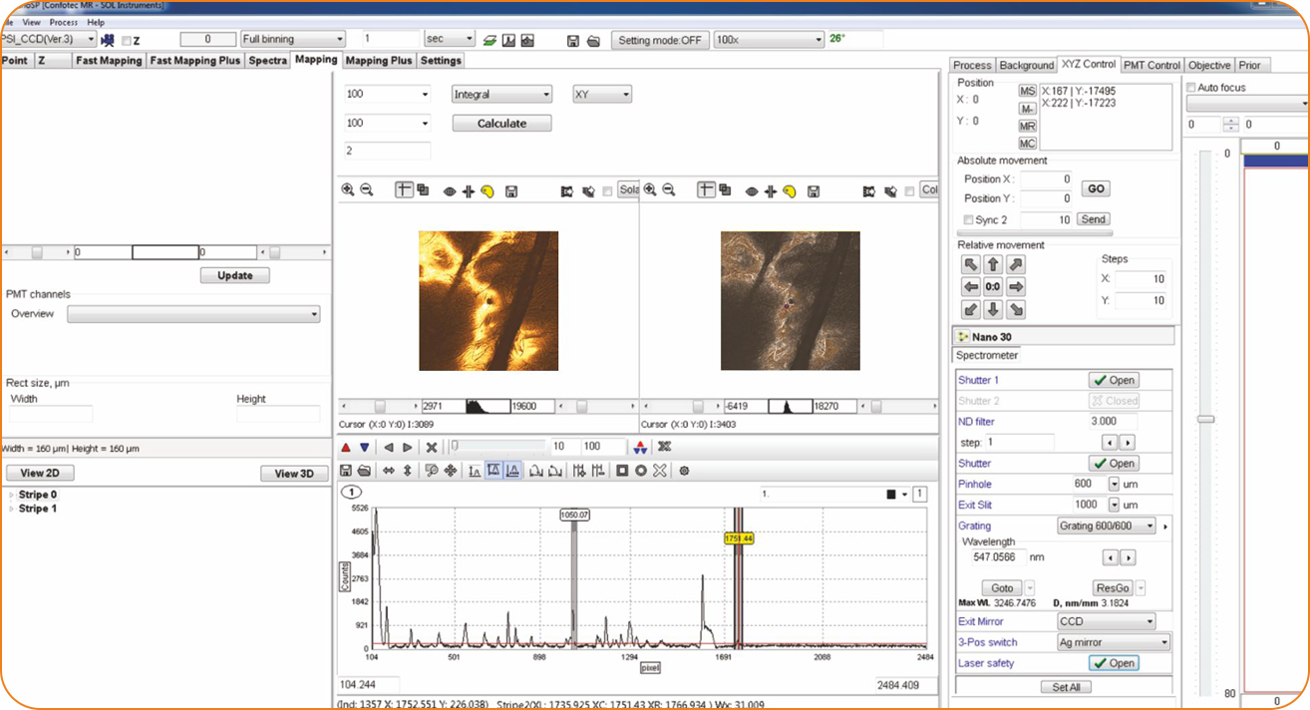
Acquisition of spectral images
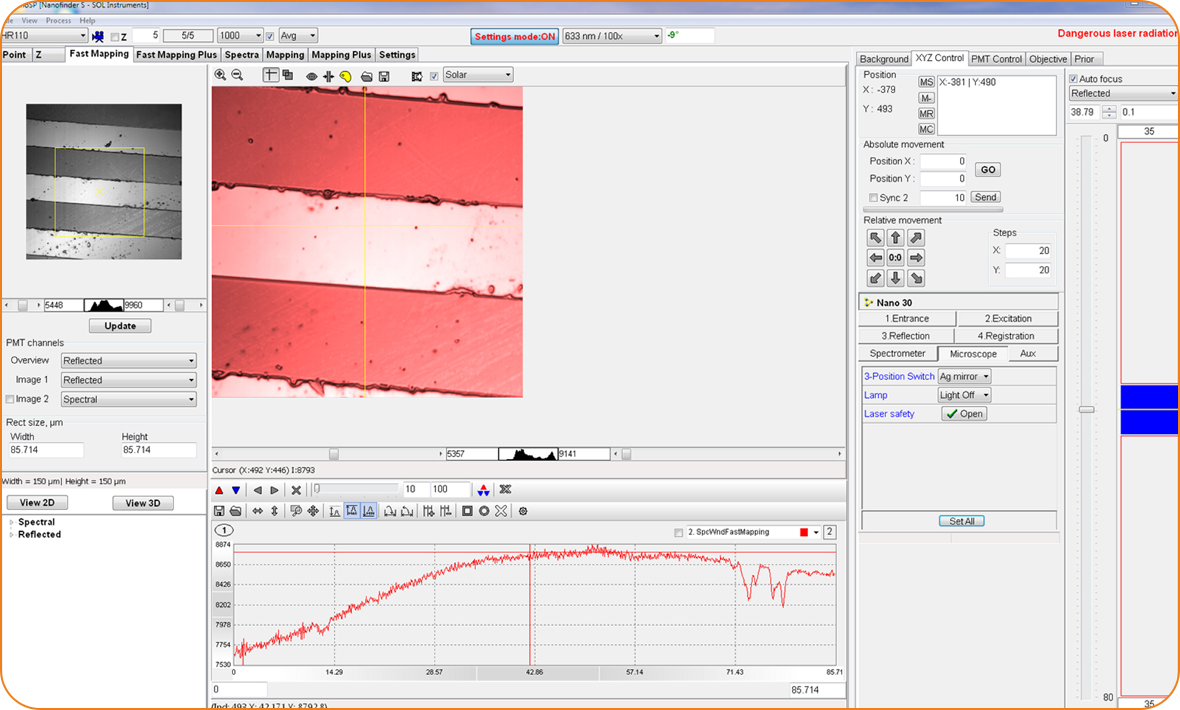
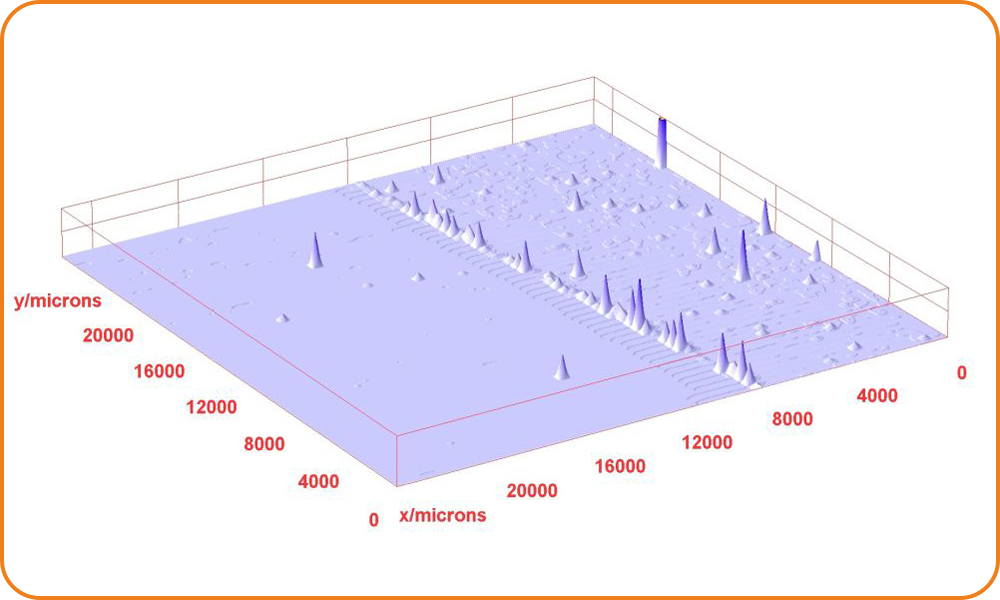
Uniquely fast mapping

Rapid panoramic mapping
Automated spectral calibration with a built-in light source
The best wavelength accuracy by utilizing a compact reference light source
Acquiring spectral images of the objects
Rapid panoramic mapping of a large sample area with the galvanic mirror scanner and automated stage
Metrical and statistical image analysis
Image processing
Axonometric representation of images

Metrical and statistical image analysis
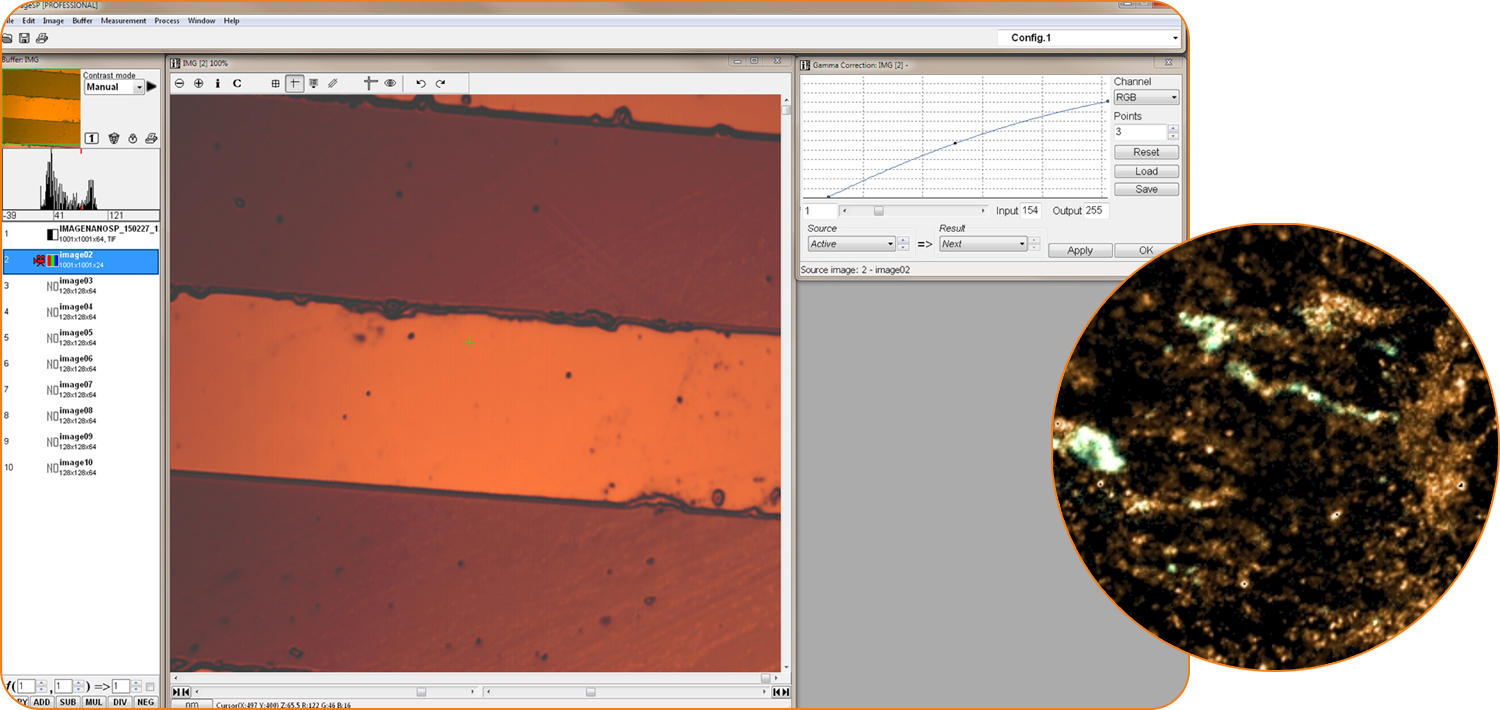
Image processing
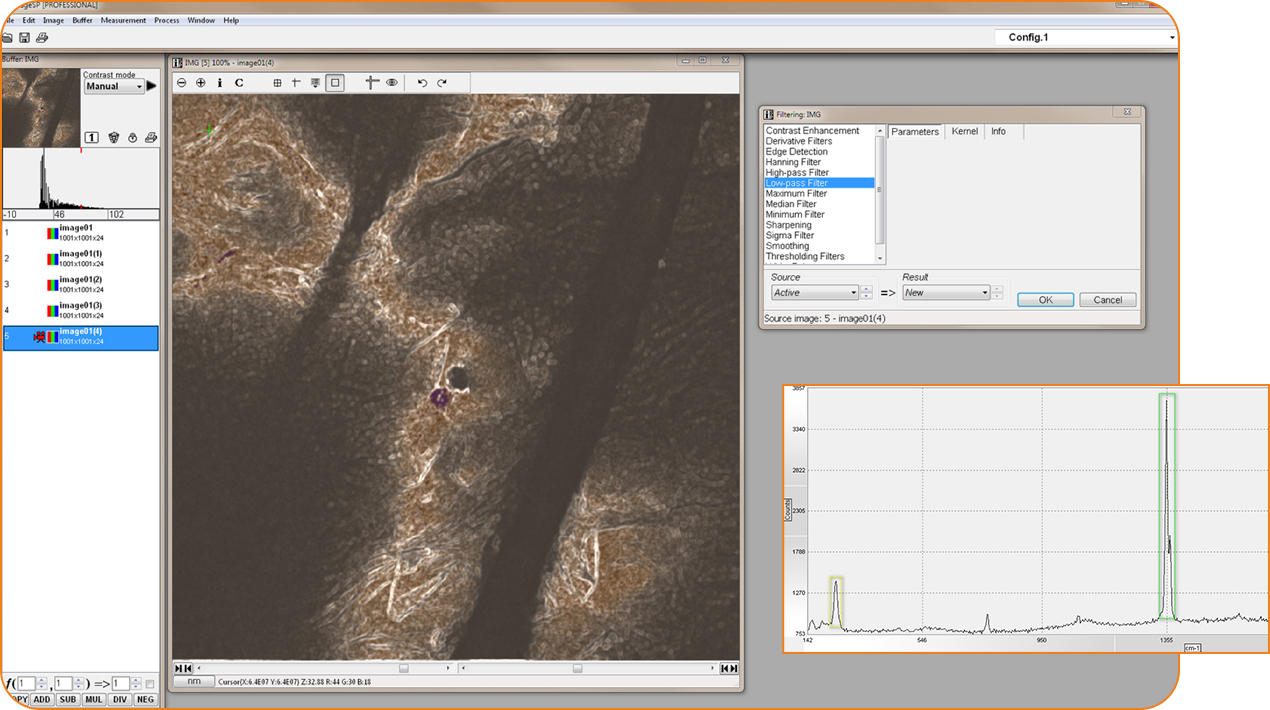
Digital filtering of images
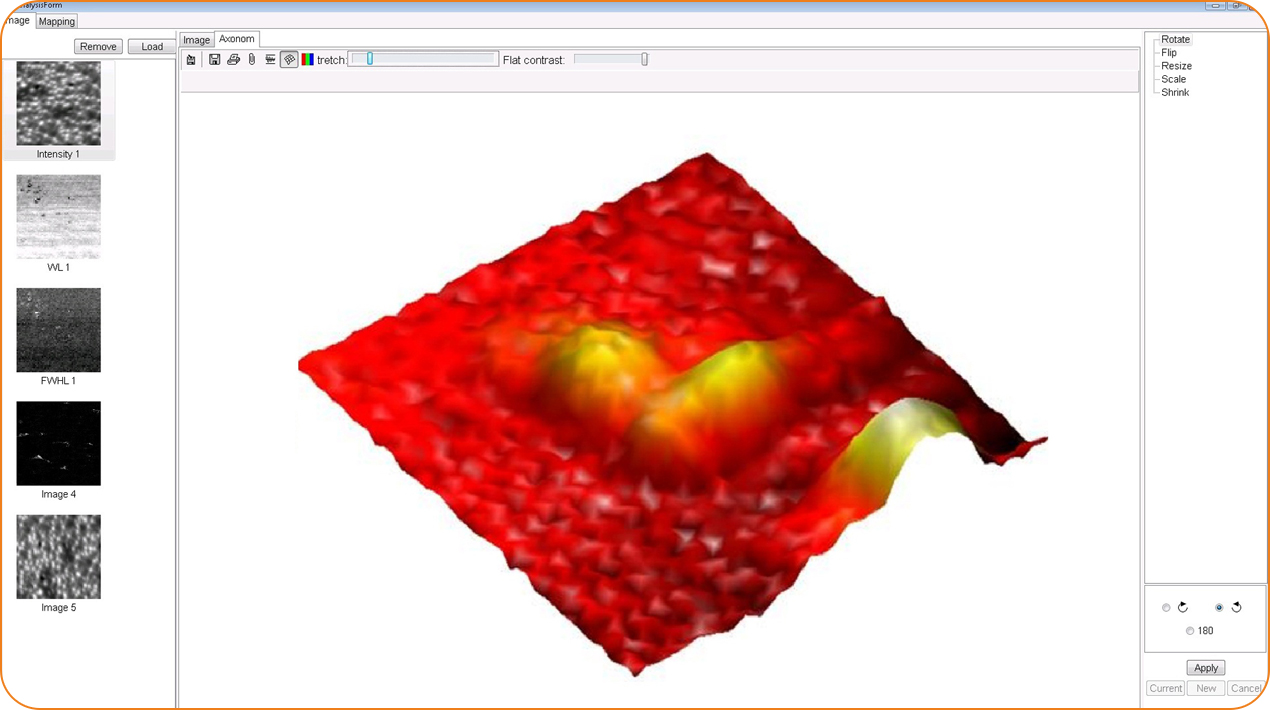
Axonometric representation of images

Section view

Mathematical operations

Automated focusing on a sample surface
Section view
Mathematical operations with spectra and images
Automated focusing on a sample surface with reflected unit
When you change between the objectives, the NanoSP software can ensure you are focused. Automated focusing on the sample surface performs with the use of the reflected laser light.
Linking to the Raman spectral databases
Optional chemometric software package
3D data analysis and visualization
Experiment management and program configuring

Linking to the Raman spectral databases
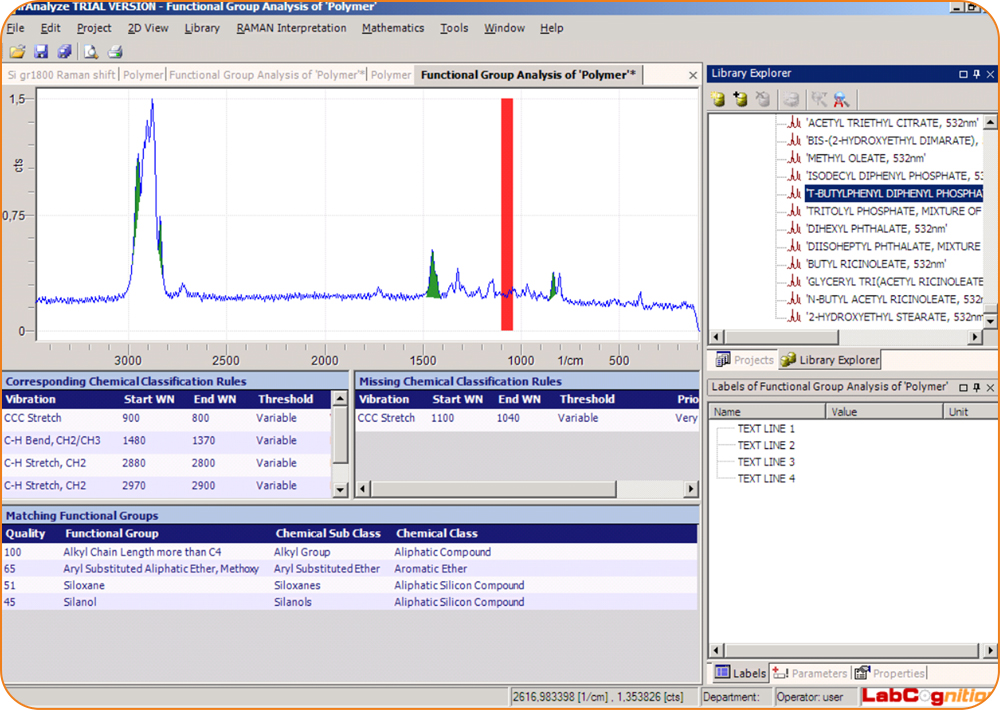
Spectrum interpretation
Chemometric software package
