
SOL instruments has implemented OptiGrate’s BragGrate™ Notch Filters (BNFs) [1] in Confotec™ NR500 allowing measurements of low frequency Raman spectra (below 50 cm-1).
Low frequency Raman spectroscopy provides valuable information on a wide variety of materials, e.g. polymers (LA modes), crystals (lattice modes), carbon nanotubes (Radial breathing modes), Graphene layers (C-bands), Semiconductors (folded acoustic modes), Gases (rotation modes), pharmaceutical tablets (low frequency signatures), etc.
Fig.1 shows the low frequency Raman spectrum of Sulfur. This spectrum demonstrates the Confotec™ NR500 measurement capability (as well as the Stokes and anti-Stokes measurements).
Confotec™ NR500 system was also tested on CdI2 polytypes. The measured low frequency Raman spectra at room temperature are presented in Fig.2. Several folded modes have been observed.
A narrow peak at 15.8 cm-1 is the E2 mode of the 4H polytype (space group C64v). Two further bands correspond to Eg (45.1 cm-1) and Ag (111.3 cm-1) modes of the 2H polytype with D33d symmetry.
The interlayer shear Raman mode of few layer graphene (C-band) can be observed from 43 cm-1 (in bulk graphene) to 32 cm-1 (in bilayer graphene). In this work, we show that C-band detection is possible by utilizing Confotec™ NR500 and OptiGrate BNFs (Fig.3).
Further to previous data, various pharmaceutical tablets exhibiting low frequency Raman features were analyzed (Fig.4-6). All observed Raman peaks have frequencies very close to the excitation line.
References & Acknowledgements
We thank OptiGrate Corp, USA, for providing BragGrate™ Notch Filters BNF-633.

Fig.1. Raman spectrum of Sulfur.

Fig.2. Raman spectrum for Cadmium Iodide at room temperature.
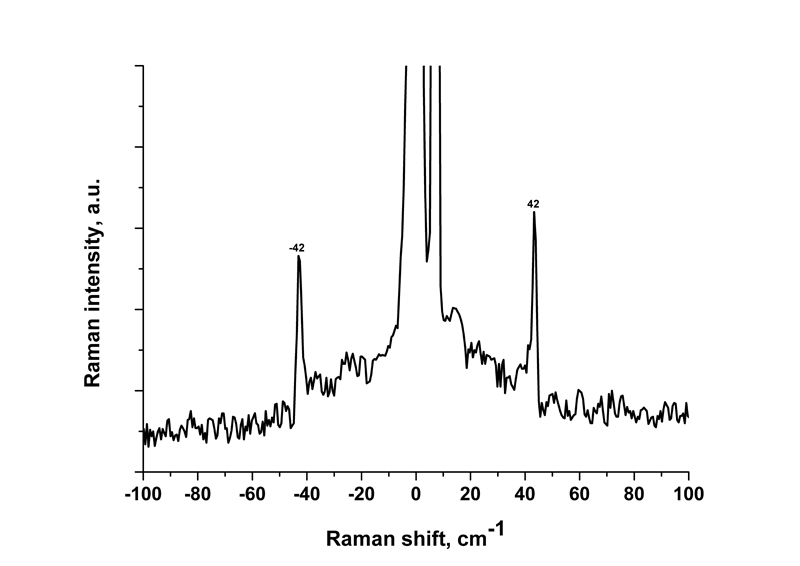
Рис.3. C-band of Graphene containing several layers.

Fig.4. Raman spectrum of Ibuprofen.

Fig.5. Raman spectrum of Aspirin (Acetylsalicylic acid).
